Lumax Industries |2QFY2019 Result Update
October 26, 2018
LUMAX Industries
BUY
CMP
`1620
Target Price
`2500
Quarterly (` cr)
Q2FY19
Q2FY18
% yoy Q1FY19
% qoq
Investment Period
12 Months
Net sales
518
380
36%
496
4%
EBITDA
41
30
34%
41
-1%
EBITDA margin (%)
7.8%
8.0%
-13
8.2%
-26
Stock Info
Adjusted PAT
21
21
-0.2%
22
-6%
Sector
Auto-Ancillary
Market Cap (` cr)
1,515
Source: Company, Angel Research
Beta
1.3
Lumax Industries limited (Lumax), posted decent revenue growth in 2QFY2019, up 36%
52 Week High / Low
2585/1553
Avg. Weekly Volume
889
yoy to `518cr from `380cr in 2QFY2018. However, the bottom-line growth was flattish
Face Value (`)
10
owing to negative impact of foreign exchange and reduction in profit from associate.
BSE Sensex
33,690
Nifty
10,124
We believe that adoption of new technology in LED lighting and addition of newer
Reuters Code
LUMA.BO
Bloomberg Code
LUMX IN
models will aid the company to maintain the current growth rate going forward.
In 2QFY2019, share of LED remained at similar levels like that 1QFY2019; however it has
Shareholding Pattern (%)
improved from 8% in FY2017 to 35% in Q2FY19. Further, we expect margins to be in the
Promoters
75.0
range of 8.0%-8.5% at least for next 2-3 quarters, as localization of import content is yet
MF / Banks / Indian Fls
1.1
to turnaround. Moreover, we project that margins will start improving from Q2FY2020
FII / NRIs / OCBs
0.9
owing to implementation of localization coupled with increase in revenue share from
Indian Public / Others
23.0
LED lighting.
For the quarter under review, Lumax has made new launches in 2W, PV and CV. In our
Abs.(%)
3m
1yr
3yr
view, 2W segment (Destini 125-Hero MotoCorp Ltd.)) will aid revenues going forward
Sensex
(1.9)
2.0
23.1
along with other new launches like Gurkha (PV-Force Motors Ltd.) and Ape (CV- Piaggio
LUMAXIND
(28.0)
(4.1)
254.0
Vehicles Pvt. Ltd).
Outlook and Valuation: We have a positive outlook on Lumax from a long term
perspective and we expect the company to grow above the industry growth rate going
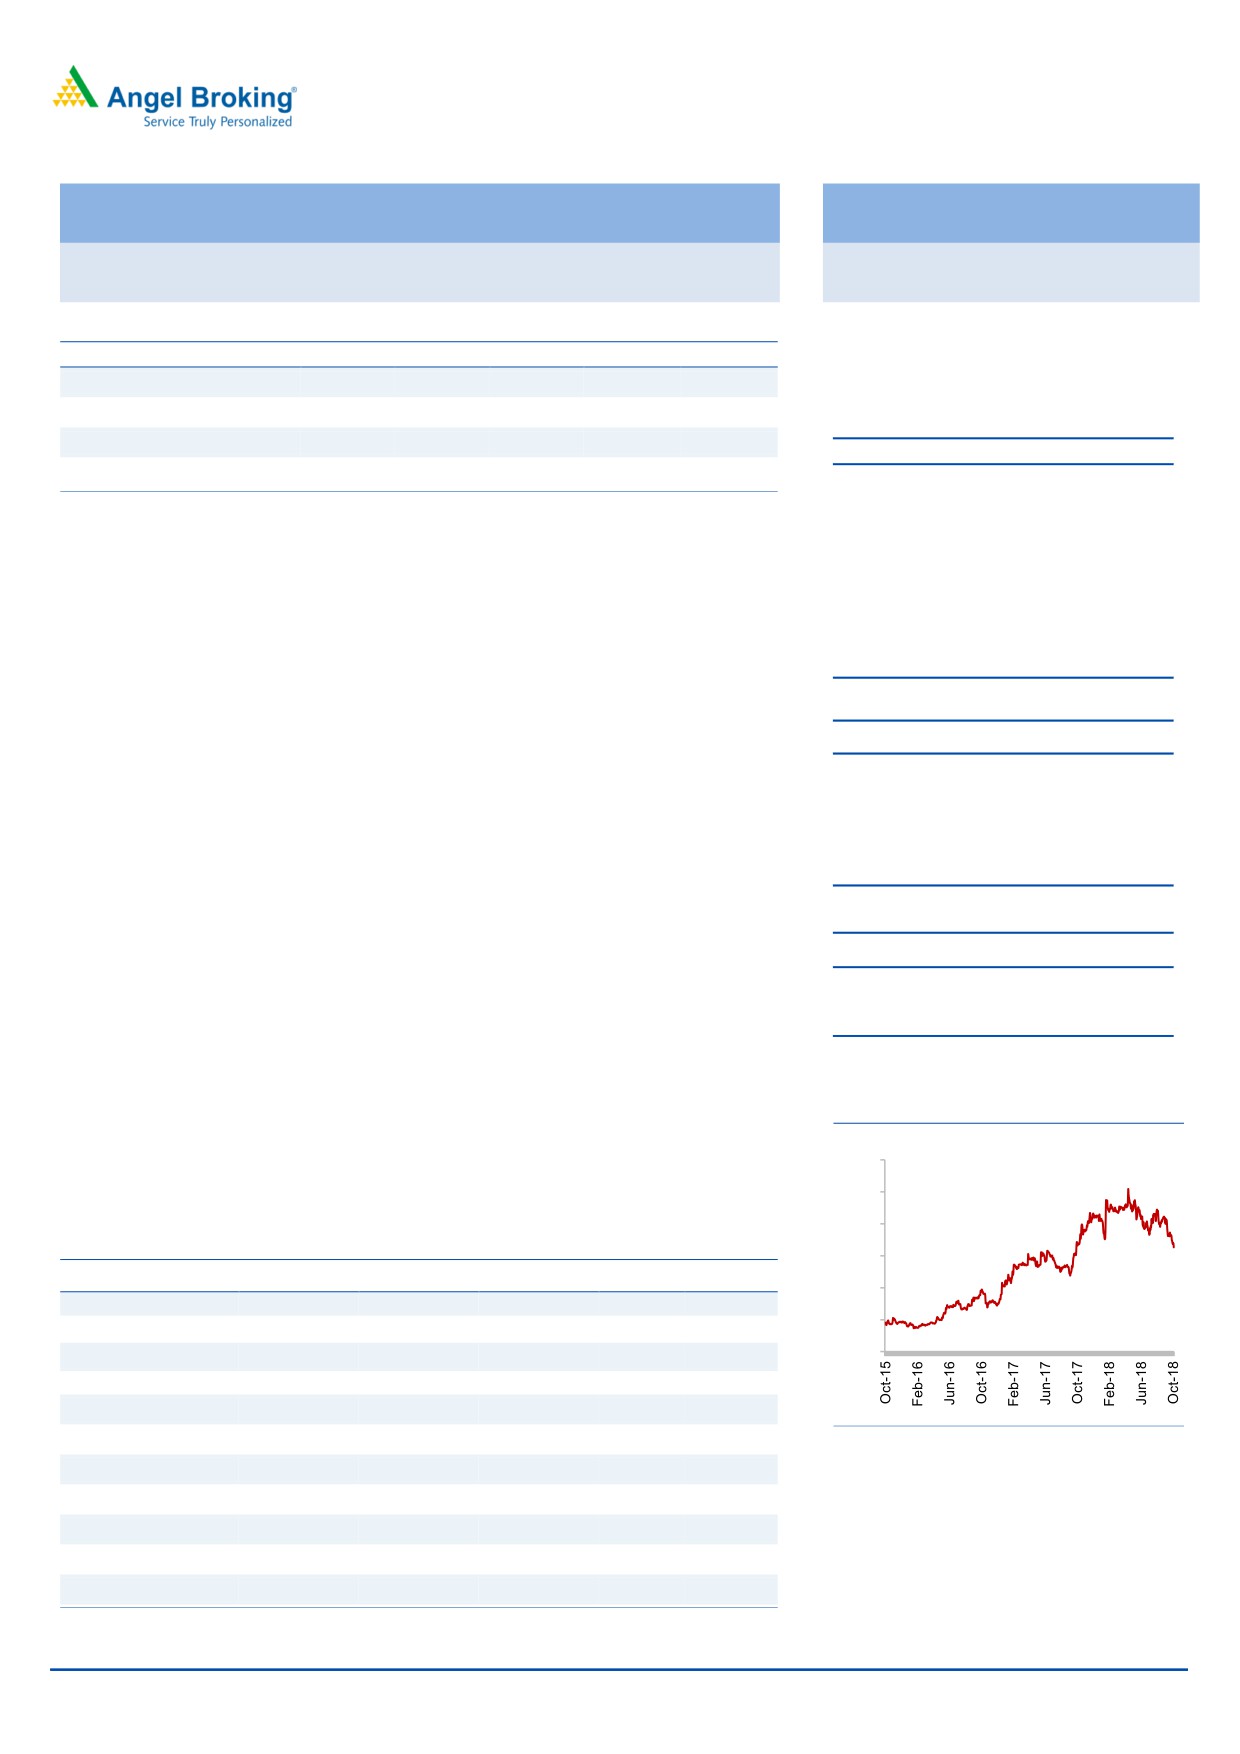
3 Years Performance charts
ahead. At the CMP of `1,620, stock is available at 14x its FY20E EPS of `119. We maintain
3000
our BUY recommendation on Lumax with a target price of `2,500 (reduced from `2,550),
2500
implying a potential upside of 54%.
2000
Exhibit 1: Key Financials
1500
Y/E March (` cr)
FY16
FY17
FY18
FY19E
FY20E
1000
Net Sales
1,255
1,271
1,650
1,980
2,336
500
% chg
10
1
30
20
18
0
Net Profit
52
54
71
84
111
% chg
2,160
4
31
18
32
EBITDA (%)
7.1%
7.9%
8.2%
8.2%
8.9%
EPS (Rs)
39
58
76
90
119
Source: Capitaline, Angel Research
P/E (x)
41
28
21
18
14
P/BV (x)
5.6
4.9
4.2
3.5
2.9
Kripashankar Maurya
RoE (%)
13.7
17.6
19.7
19.5
21.4
022 39357600, Extn: 6004
RoCE (%)
13.9
15.2
18.7
19.7
22.4
EV/EBITDA
18.1
15.7
11.9
9.7
7.6
Source: Company, Angel Research; Note: CMP as of Oct 25, 2018
October 26, 2018
1
Lumax Industries |2QFY2019 Result Update
Exhibit 1: Q2FY19 Performance
In Cr
Q2FY19
Q2FY18
Q1FY19
YOY %
QOQ%
Net Sales
518
380
496
36%
4%
Total Income
518
380
496
36%
4%
Total Expenditure
477
349
455
37%
5%
Raw Material Consumed
338
248
331
36%
2%
Stock Adjustment
4
-4
-11
NA
NA
Purchase of Finished Goods
3
2
4
82%
-24%
COGS
345
246
324
40%
6%
Employee Expenses
55
45
54
22%
3%
Other Expenses
77
58
78
32%
-1%
As a % of sales
Raw Material Consumed
65%
65%
67%
Stock Adjustment
1%
-1%
-2%
Purchase of Finished Goods
1%
0%
1%
COGS
67%
65%
65%
Gross Margin %
33%
35%
35%
Employee Expenses
11%
12%
11%
Other Expenses
15%
15%
16%
EBITDA
41
30
41
34%
-1%
Other Income
1.08
0.8
3.1
38%
-65%
Profit from Associate
1.83
6.7
3.2
-73%
-43%
Interest
3.68
1.2
3.1
220%
20%
PBDT
39.77
36.56
43.99
9%
-10%
Depreciation
13.81
11
14
20%
2%
PBT
25.96
25.09
30.45
3%
-15%
Tax
5.09
4
8
22%
-38%
PAT
21
21
22
0%
-6%
Ratios
BPS
BPS
EBITDA margin (%)
7.83%
7.95%
8.21%
-13
-38
PAT margin %
4.03%
5.51%
4.48%
-148
-45
Tax rate %
19.60%
16.65%
26.99%
295
-738
Source: Company, Angel Research
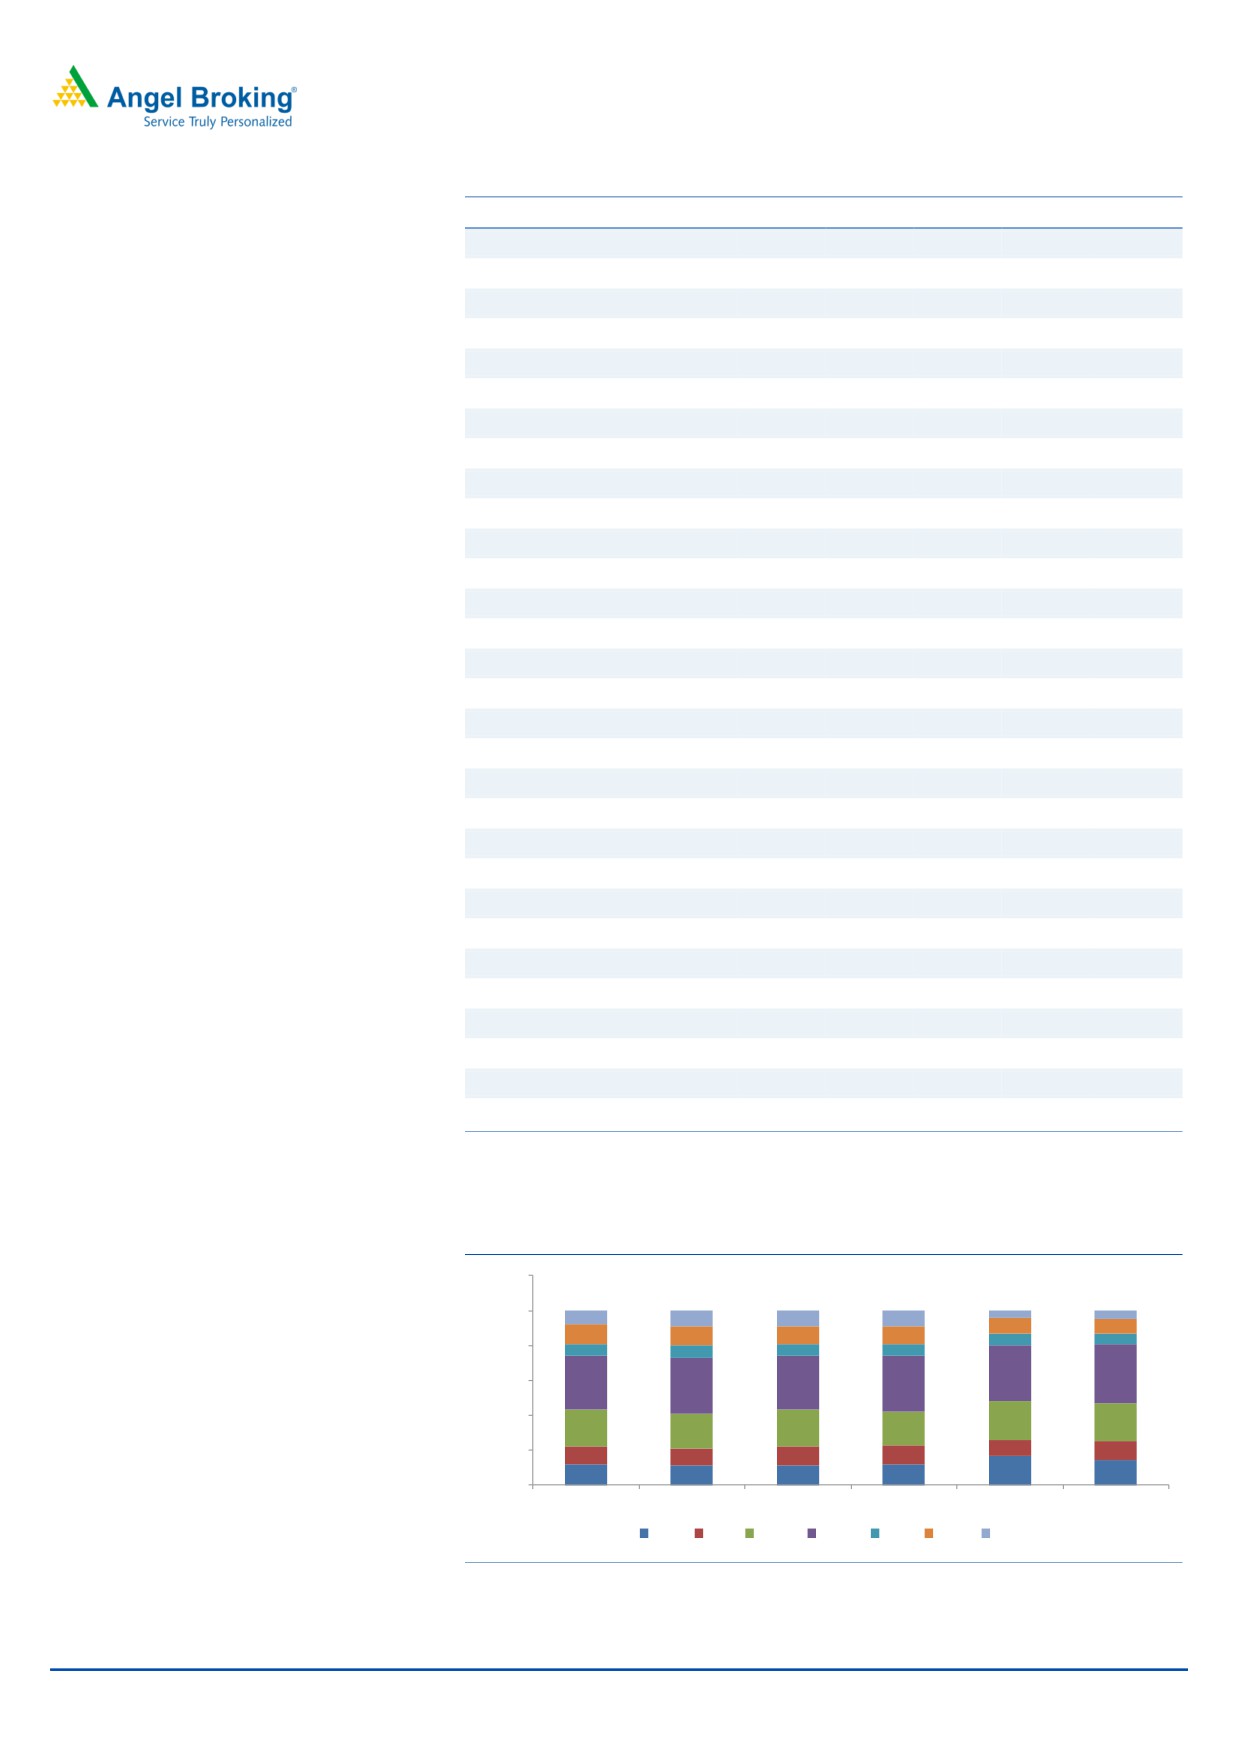
Customer wise sales mix
120.0%
100.0%
4.0%
5.0%
8.0%
9.0%
9.0%
9.0%
9.0%
8.0%
11.0%
11.0%
10.0%
10.0%
7.0%
6.0%
80.0%
7.0%
7.0%
7.0%
7.0%
32.0%
34.0%
60.0%
31.0%
32.0%
31.0%
32.0%
40.0%
22.0%
22.0%
21.0%
20.0%
21.0%
19.0%
20.0%
9.0%
11.0%
10.0%
10.0%
11.0%
11.0%
12.0%
11.0%
11.0%
12.0%
17.0%
14.0%
0.0%
Q1FY18
Q2FY18
Q3FY18
Q4FY18
Q1FY19
Q2FY19
HMSI HML
Others
Maruti
TATA
M&M HCIL
Source: Company, Angel Research
October 26, 2018
2
Lumax Industries |2QFY2019 Result Update
Q2FY2019 Key highlights of post result and concall
Lumax has reported robust revenue growth of 36% yoy to `518cr in Q2FY19
owing to strong growth from key customers viz. HMSI (76%), HML (52%) and
Maruti (47%). However, revenue from HCIL de-grew 25% yoy, as it was
unable to supply to few models like Amaze and City which have performed
well.
Despite an increase in revenue, bottom-line, on consolidated basis, remained
stable owing to forex loss of `4.3cr as against forex gain of `0.5cr in same
quarter last year, however it can be passed on to the customers post
negotiation with respective clients.
Management expects to bring down the import component of LED to 50% by
FY2020 from 65% currently, which will help to improve operating margins.
Outlook and Valuation: We have a positive outlook on Lumax from a long term
perspective and we expect the company to grow above the industry growth rate going
ahead. At the CMP of `1,620, stock is available at 14x its FY20E EPS of `119. We
maintain our BUY recommendation on Lumax with a target price of `2,500 (reduced
from `2,550), implying a potential upside of 54%.
Risks to our estimates
Downside risk to target revenue and net income is slower than expected
adoption of LED lamp by OEM’s and higher content of import raw material
respectively.
Upside risk to target revenue is faster growth in PV and 2W segments.
October 26, 2018
3
Lumax Industries |2QFY2019 Result Update
Income statement
Y/E March (` cr)
FY16
FY17
FY18
FY19E FY20E
Total operating income
1,255
1,271
1,650
1,980
2,336
% chg
10
1
30
20
18
Total Expenditure
1,167
1,170
1,515
1,817
2,128
Raw Material
767
818
1,104
1,317
1,565
Personnel
141
160
189
208
245
Selling and Administration Expenses
76
86
107
128
151
Others Expenses
183
106
115
164
166
EBITDA
89
101
135
163
208
% chg
(65)
14
34
21
28
(% of Net Sales)
7.1%
7.9%
8.2%
8.2%
8.9%
Depreciation& Amortisation
38
41
48
58
69
EBIT
51
60
87
105
139
% chg
(76)
18
46
21
33
(% of Net Sales)
4
5
5
5
6
Interest & other Charges
13
11
8
12
12
Other Income
4
17
19
21
23
Extraordinary Items
-
-
-
Recurring PBT
41
65
98
113
150
% chg
(80)
58
51
16
32
Tax
4
10
26
29
39
PAT (reported)
37
54
71
84
111
% chg
(82)
48
31
18
32
(% of Net Sales)
2.9
4.3
4.3
4.2
4.8
Basic & Fully Diluted EPS (Rs)
39
58
76
90
119
% chg
122
48
31
18
32
Source: Company, Angel Research
October 26, 2018
4
Lumax Industries |2QFY2019 Result Update
Balance Sheet
Y/E March (`cr)
FY16
FY17
FY18
FY19E FY20E
SOURCES OF FUNDS
Equity Share Capital
9.4
9.4
9.4
9.4
9.4
Reserves& Surplus
259
300
353
421
511
Shareholders Funds
268
309
362
430
520
Total Loans
95
83
101
101
101
Other Liabilities
51
32
47
50
50
Total Liabilities
415
423
510
581
672
APPLICATION OF FUNDS
Net Block
425
419
532
640
771
Capital Work-in-Progress
-
20
34
20
20
Investments
69
79
88
105
117
Long Term Loans & Advances
31
2
4
4
4
Current Assets
332
348
562
659
730
Inventories
105
116
169
212
224
Sundry Debtors
181
191
318
391
474
Cash
3
1
2
32
30
Loans & Advances
36
-
1
1
2
Investments & Others
7
40
73
24
0
Current liabilities
444
456
721
857
981
Net Current Assets
-111
-109
-159
-198
-251
Other Non Current Asset
1
11
11
11
11
Total Assets
415
423
510
581
672
Source: Company, Angel Research
Cash flow
Y/E March (`cr)
FY16
FY17
FY18
FY19E FY20E
Profit before tax
41
65
98
113
150
Depreciation
38
41
48
58
69
Change in Working Capital
(0)
7
17
(14)
(45)
Interest / Dividend (Net)
13
11
8
12
12
Direct taxes paid
4
10
26
29
39
Others
(7)
(24)
(40)
(29)
(39)
Cash Flow from Operations
89
111
157
170
186
(Inc.)/ Dec. in Fixed Assets
(38)
(63)
(132)
(119)
(149)
(Inc.)/ Dec. in Investments
1
1
4
(17)
(12)
Cash Flow from Investing
(37)
(62)
(128)
(137)
(161)
Issue of Equity
-
-
-
-
-
Inc./(Dec.) in loans
61
-13
19
-
-
Others
(120)
(27)
(30)
(19)
(27)
Cash Flow from Financing
(59)
(39)
(11)
(19)
(27)
Inc./(Dec.) in Cash
(7)
10
17
14
(3)
Opening Cash balances
18
3
1
19
32
Closing Cash balances
3
1
19
32
30
Source: Company, Angel Research
October 26, 2018
5
Lumax Industries |2QFY2019 Result Update
Key Ratio
Y/E March
FY16
FY17
FY18
FY19E FY20E
P/E (on FDEPS)
41
28
21
18
14
P/CEPS
17
16
13
11
8
P/BV
6
5
4
4
3
EV/Sales
1
1
1
1
1
EV/EBITDA
18
16
12
10
8
EV / Total Assets
3
3
3
3
3
Per Share Data (Rs)
EPS (Basic)
39
58
76
90
119
EPS (fully diluted)
39
58
76
90
119
Cash EPS
96
102
128
152
192
DPS
0
0
14
17
22
Book Value
287
331
387
460
556
Returns (%)
ROCE
14
15
19
20
22
Angel ROIC (Pre-tax)
15
18
22
25
28
ROE
14
18
20
20
21
Turnover ratios (x)
Inventory / Sales (days)
30
33
37
39
35
Receivables (days)
53
55
70
72
74
Payables (days)
90
94
119
119
110
Working capital cycle (ex-cash) (days)
-7
-6
-11
-8
-1
Source: Company, Angel Research
October 26, 2018
6
Lumax Industries |2QFY2019 Result Update
Research Team Tel: 022 - 39357800
DISCLAIMER:
Angel Broking Limited (hereinafter referred to as “Angel”) is a registered Member of National Stock Exchange of India Limited, Bombay Stock
Exchange Limited, Metropolitan Stock Exchange Limited, Multi Commodity Exchange of India Ltd and National Commodity & Derivatives
Exchange Ltd It is also registered as a Depository Participant with CDSL and Portfolio Manager and Investment Adviser with SEBI. It also has
registration with AMFI as a Mutual Fund Distributor. Angel Broking Limited is a registered entity with SEBI for Research Analyst in terms of
SEBI (Research Analyst) Regulations, 2014 vide registration number INH000000164. Angel or its associates has not been debarred/ suspended
by SEBI or any other regulatory authority for accessing /dealing in securities Market. Angel or its associates/analyst has not received any
compensation / managed or co-managed public offering of securities of the company covered by Analyst during the past twelve months.
This document is solely for the personal information of the recipient, and must not be singularly used as the basis of any investment decision.
Nothing in this document should be construed as investment or financial advice. Each recipient of this document should make such
investigations as they deem necessary to arrive at an independent evaluation of an investment in the securities of the companies referred to
in this document (including the merits and risks involved), and should consult their own advisors to determine the merits and risks of such an
investment.
Reports based on technical and derivative analysis center on studying charts of a stock's price movement, outstanding positions and trading
volume, as opposed to focusing on a company's fundamentals and, as such, may not match with a report on a company's fundamentals.
Investors are advised to refer the Fundamental and Technical Research Reports available on our website to evaluate the contrary view, if any
The information in this document has been printed on the basis of publicly available information, internal data and other reliable sources
believed to be true, but we do not represent that it is accurate or complete and it should not be relied on as such, as this document is for
general guidance only. Angel Broking Limited or any of its affiliates/ group companies shall not be in any way responsible for any loss or
damage that may arise to any person from any inadvertent error in the information contained in this report. Angel Broking Limited has not
independently verified all the information contained within this document. Accordingly, we cannot testify, nor make any representation or
warranty, express or implied, to the accuracy, contents or data contained within this document. While Angel Broking Limited endeavors to
update on a reasonable basis the information discussed in this material, there may be regulatory, compliance, or other reasons that prevent us
from doing so.
This document is being supplied to you solely for your information, and its contents, information or data may not be reproduced,
redistributed or passed on, directly or indirectly.
Neither Angel Broking Limited, nor its directors, employees or affiliates shall be liable for any loss or damage that may arise from or in
connection with the use of this information.
Disclosure of Interest Statement
Company Name
1. Financial interest of research analyst or Angel or his Associate or his relative
No
2. Ownership of 1% or more of the stock by research analyst or Angel or associates or relatives
No
3. Served as an officer, director or employee of the company covered under Research
No
4. Broking relationship with company covered under Research
No
October 26, 2018
7